Understanding ocean currents is essential for safe, efficient coastal navigation, yet visualizing them remains one of the most complex tasks of trip planning. Unlike wind or waves, which are relatively intuitive and often visible to the naked eye (and have stations collecting data, and broadcasting towers delivering that info daily via VHF), currents are invisible forces, shifting constantly beneath the surface.
Up to this point, we have used tide and current tables that need countless calculations (and even then you can still mess something up). The OceanConnect app, developed by the Tula Foundation (Hakai Institute) in conjunction with CIOOS Pacific, is tackling this challenge head-on by offering a user-friendly way to explore high-resolution current forecasts in British Columbia’s coastal waters.
The Invisible Puzzle
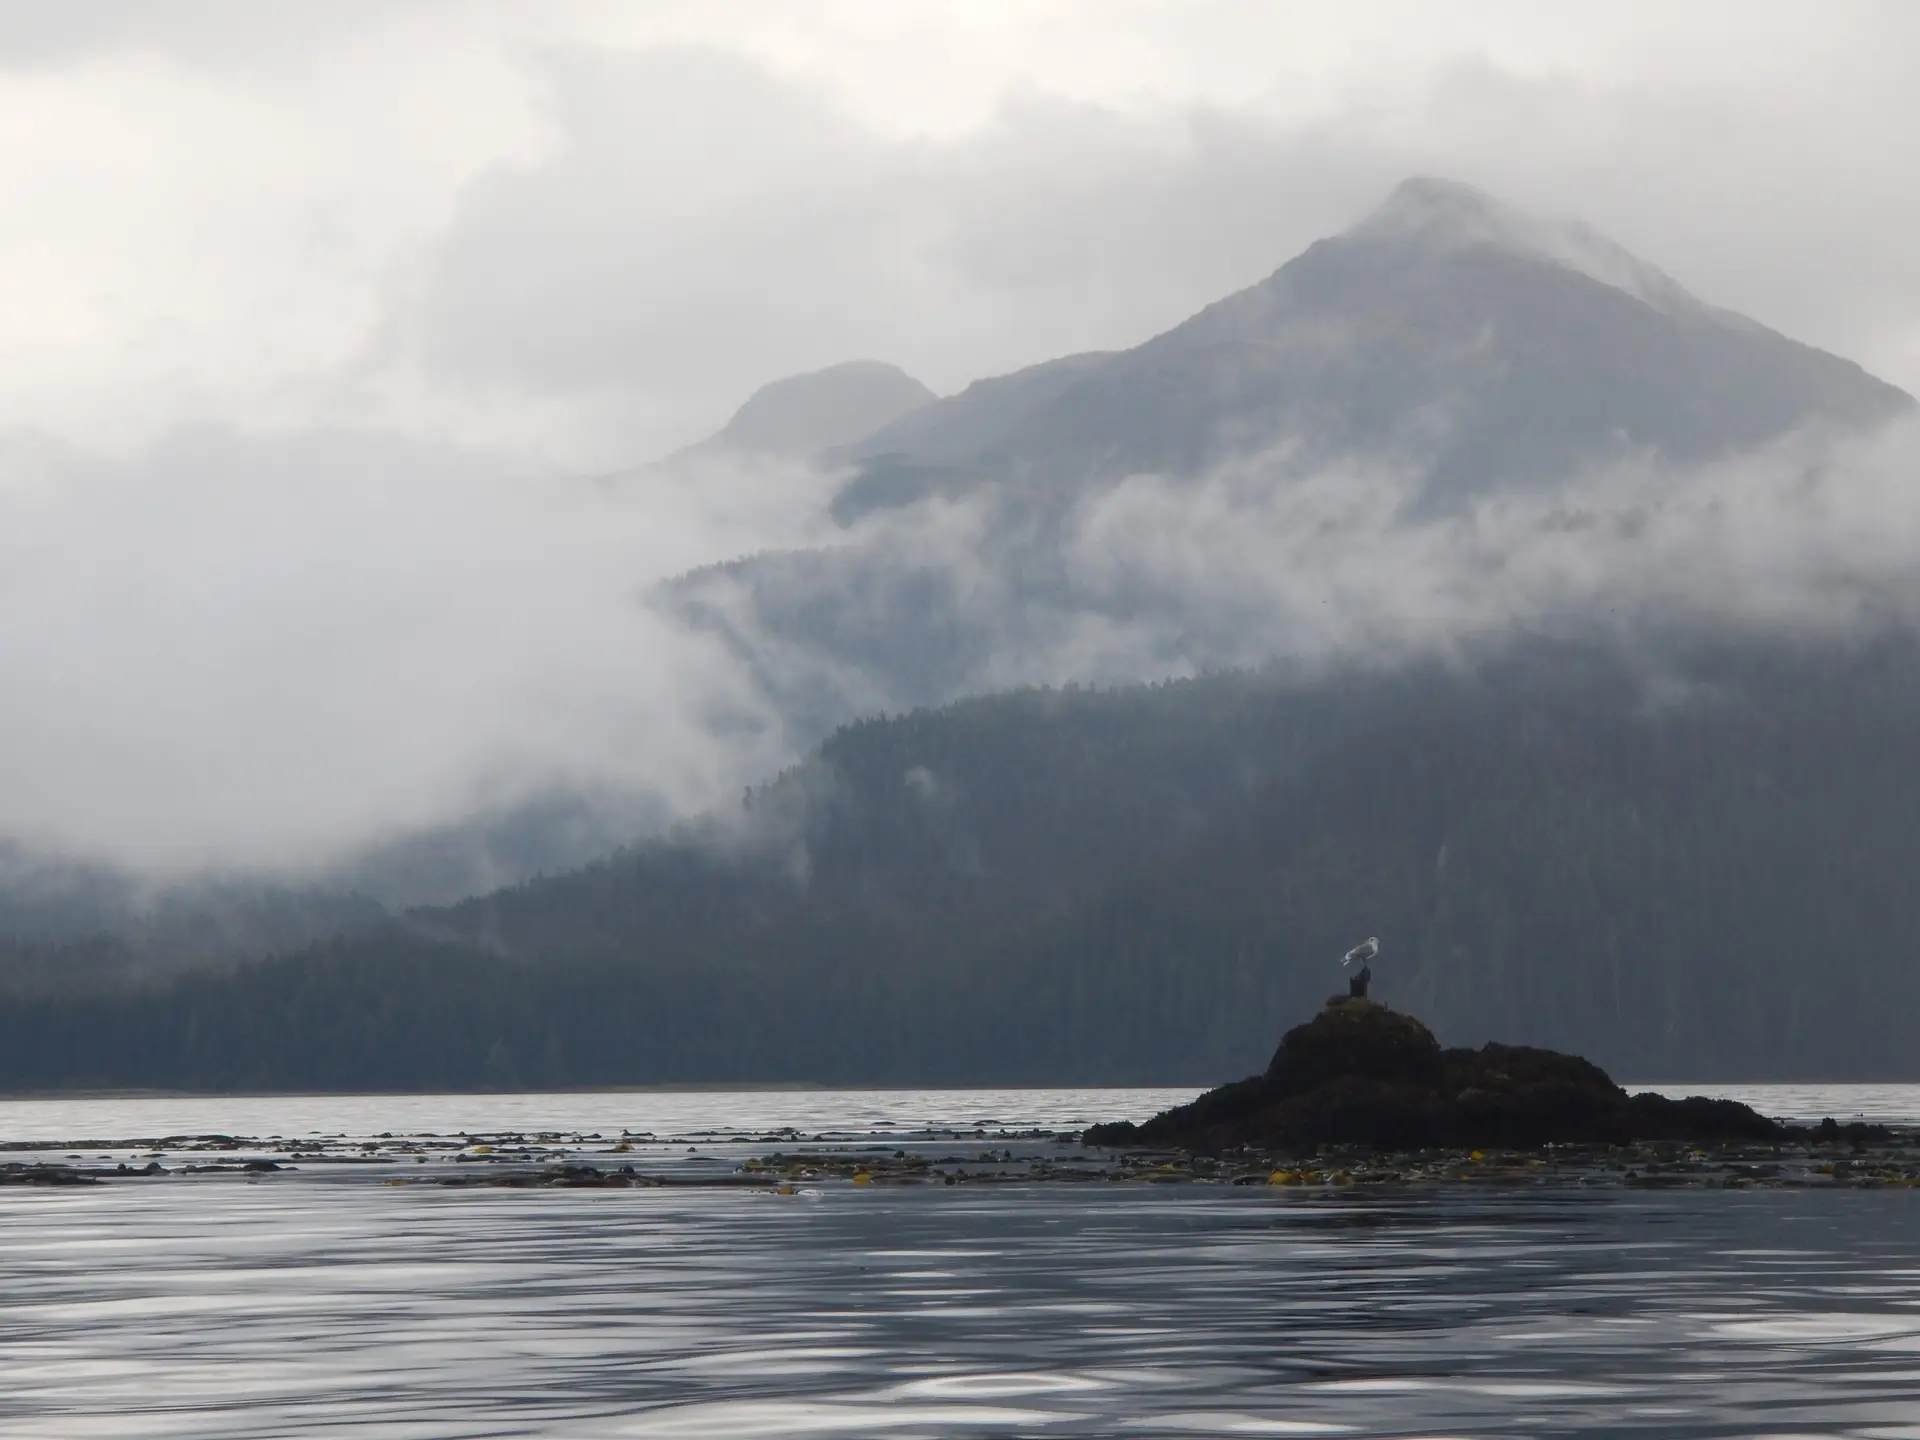
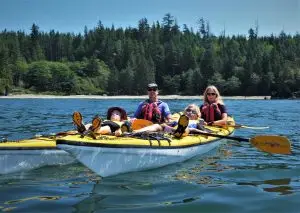
Warren Island, Alaska
Currents are driven by tides, bathymetry, wind, freshwater outflows, and shoreline geometry (there are over 50,000 islands between Seattle and Skagway). This makes currents dynamic, highly localized, and mysterious. A current in one narrows may flow opposite to a similar channel only miles away.
Some channels even ebb and flood in the same direction (wrap your head around that). Unlike wind, which can be measured with an anemometer, currents require complex modeling and dense observational data to predict accurately. To visualize them requires a breakthrough.
OceanConnect Makes Currents Click
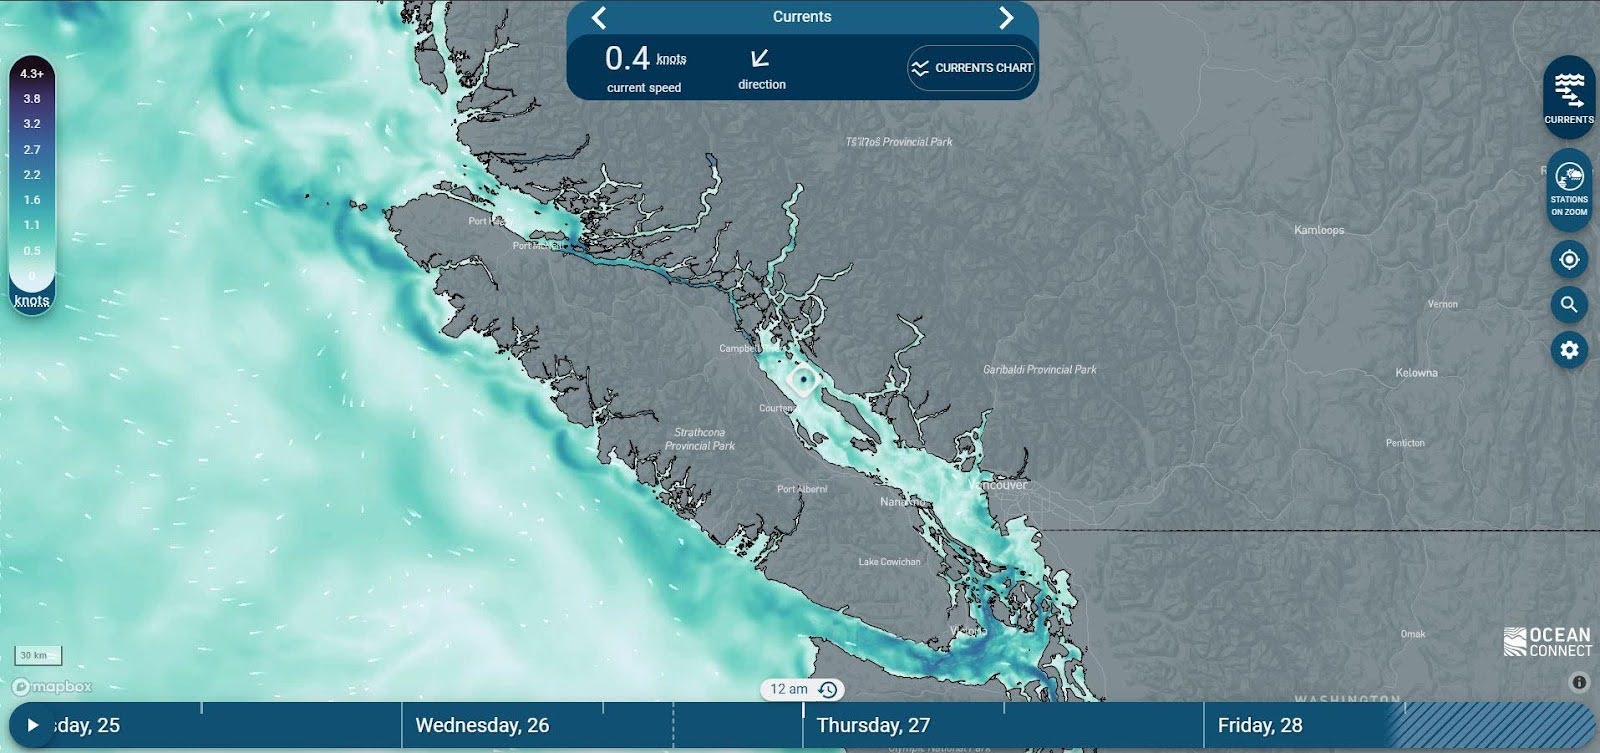
OceanConnect addresses these challenges by offering an interactive, animated current map that updates four times daily. Instead of relying on abstract arrows or vague color gradients, the app uses intuitive visualizations that show the direction and strength of currents over time. Users can scrub through the forecast to see how conditions evolve, helping them plan around tidal shifts or avoid areas with strong opposing flows.
The app’s current data is based on high-resolution models tailored specifically for BC’s coastal waters, including the Salish Sea. These models incorporate local bathymetry, tidal harmonics, and meteorological inputs to produce forecasts that are far more accurate than generic global models.
Why?
For paddlers, sailors, and coastal mariners, understanding currents isn’t academic—it’s critical. A strong current can double (or half) your travel time, push you off course, or create hazardous conditions near headlands and narrows. By visualizing these forces in a clear, accessible way, OceanConnect empowers users to make smarter decisions, conserve energy, and stay safe.
OceanConnect map along BC’s coast
Room for Improvement
The current issue with OceanConnect is resolution. It does not take in islands less than 500m and it often can’t figure out currents in extreme narrows, like Gale Passage in Bella Bella, where it essentially breaks down. So when using OceanConnect, use it as an aid, and never take tech as the bible. A couple other downsides: the colour scheme makes it look like it’s snowing :), and it’s not very accessible offline.
A Tool for Everyone
OceanConnect is free, mobile-friendly, and requires no registration. It’s designed for everyone and whether you’re planning a weekend paddle or just curious about what’s happening beneath the waves, OceanConnect turns the invisible into the understandable.
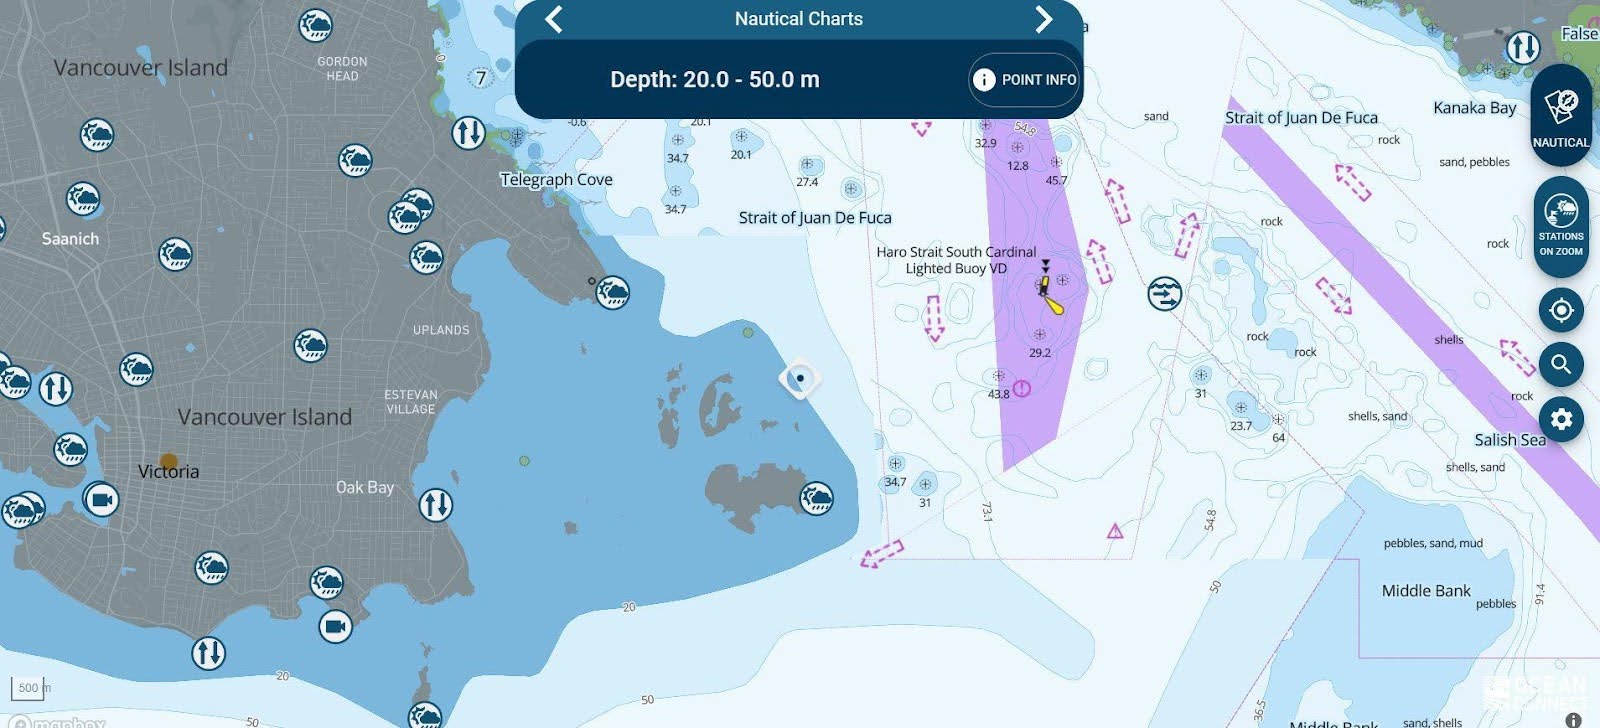
Did we mention it’s also got more layers to help plan trips? OceanConnect allows you to view:
Nautical Charts layer on OceanConnectWind speed and direction
Wave height and direction
Water temperature
Tidal information
Webcams for real-time visuals
Nautical charts (yes, all the nautical charts!)
Explore the free app at OceanConnect.ca or any app store to see the currents and other elements come to life. Used in conjunction with BCMT’s map, you have everything you need to plan trips wisely.
Bonus: A (virtual) sit down with OceanConnect developer Nate Rosenstock
What was the hardest part as a developer making this data come to life?
Sometimes there are multiple sources for the same weather station and buoy data, and it took us a while to find the most reliable sources of data. It’s all very stable now but initially stations had a lot of data gaps.
What should kayakers know before using the app? Are there any limitations to keep in mind?
Currents (Wind, too) in small channels will often be wrong. I find in these spots it often gets the timing right but not the speed. Use the current stations when they are near, these are more accurate.
As a sailor and kayaker, what made OceanConnect special for you?
I often sail a small boat with no motor, so knowing the conditions is especially important, or I end up paddling a lot. I think making the nautical charts more accessible has been the best part, there’s so much data about the coast buried in there.
What are some of the unexpected gems in this app?
I was most surprised by how useful the sea temperature layer is to our users and myself, for finding warm spots to swim. If you live in Victoria you might think the ocean is just always freezing, and we don’t often see a high resolution map of sea temperature for this area that can tell us otherwise.
What is some interesting data hidden in OC?
We have the most weather station data for coastal BC
Bamfield dock water temperature – from the newly added “School-Based Weather Station Network” stations
Lighthouse reported weather, which I haven’t seen in other apps
David Norwell is an author, illustrator, and world traveller. He holds a BSc in Geography from the University of Victoria, and has worked for six seasons conducting biological and geological surveys In BC, Alberta, and the Yukon. His passion is communicating science in a way that accesses the human heart. David has visited thirty-three countries, sailed across the Atlantic and Indian Ocean, trekked over the Himalayas with a kitten, and hitchhiked over two hundred rides. He is dedicated to understanding the human experience and sharing his findings. When not working on books, he is volunteering at schools, studying Buddhism, and practising meditation.
We use basic cookie information to track things like which pages are viewed by visitors, in order to help improve our content. This information is used within Google Analytics, but is not provided to third parties.
By continuing to use this website, you consent to the use of cookies in accordance with our Privacy Policy, which can be found at the bottom of this page.